How to Use Volatility as a Decision Tool for Traders and Investors
admin - May 15, 2026Understanding Volatility
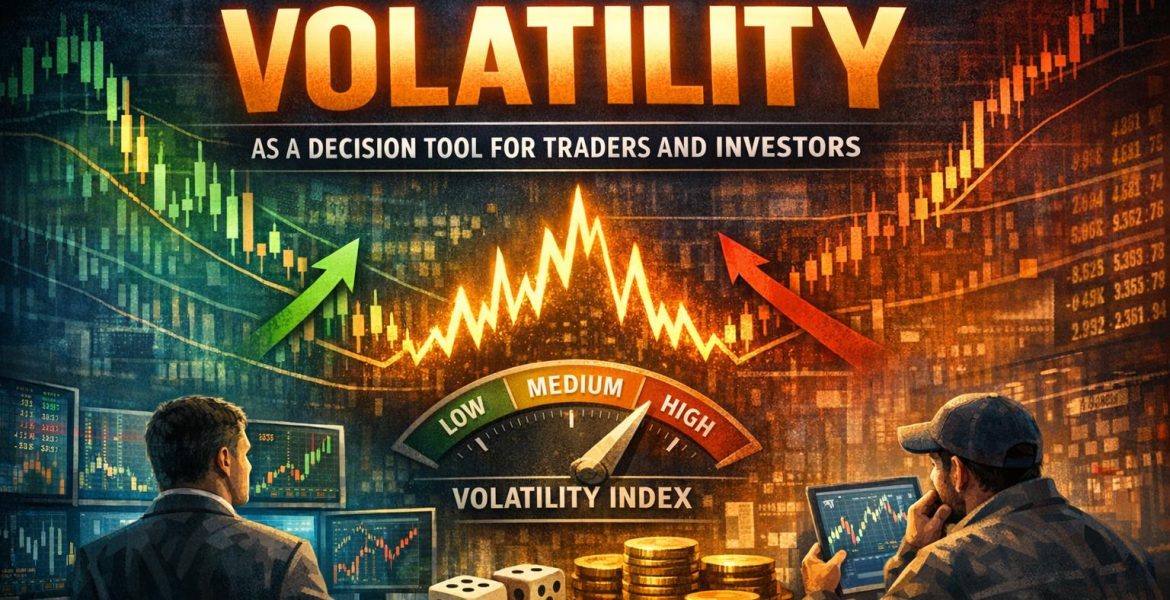
Volatility in financial markets refers to the degree of variation in the price of a financial instrument over time. It indicates how widely and how quickly prices move relative to their average level. When markets are described as highly volatile, prices tend to fluctuate rapidly and by large margins. In contrast, low-volatility markets display smaller, more gradual price changes. Volatility is not inherently negative or positive; rather, it is a statistical description of uncertainty and dispersion.
In practical terms, volatility reflects the pace at which new information is incorporated into asset prices. Economic data releases, corporate earnings announcements, geopolitical developments, and changes in monetary policy can all alter expectations about future cash flows and risk. As expectations shift, so do prices. The cumulative effect of these adjustments is observed as volatility.
Market participants monitor volatility because it affects valuation, risk assessment, and strategic planning. Portfolio managers consider volatility when determining asset allocation, estimating expected returns, and setting performance objectives. Traders monitor short-term volatility to identify trading ranges, breakout points, and potential reversals. Risk officers rely on estimates of volatility to set margin requirements and capital reserves.
Although volatility often attracts attention during periods of financial stress, it is a constant feature of markets. Even in relatively calm periods, price fluctuations contain information about supply, demand, and investor expectations. Understanding the sources and mechanics of volatility provides a foundation for effective financial decision-making.
Types of Volatility
Volatility can be categorized into several types based on measurement and interpretation. Historical volatility, also known as realized volatility, measures the actual dispersion of returns observed over a specific period in the past. It is calculated directly from price data and provides an objective record of how turbulent or stable an asset has been.
Implied volatility, by contrast, is forward-looking. It is derived from the market price of options and reflects collective expectations about future price variability. While historical volatility summarizes what has occurred, implied volatility estimates what market participants anticipate will occur.
Another distinction is between absolute volatility and relative volatility. Absolute volatility refers to the degree of price movement of a single asset. Relative volatility compares the variability of different assets or market sectors. Investors use relative measures to identify which instruments carry higher risk or exhibit stronger price swings.
Volatility can also be examined across different time horizons. Short-term volatility may reflect temporary imbalances in order flow, while long-term volatility often relates to fundamental uncertainty about economic growth, corporate earnings, or structural shifts in an industry. Recognizing these distinctions helps align analytical methods with investment objectives.
Measuring Volatility
Volatility can be measured using several statistical tools. One widely used measure is standard deviation, which calculates the dispersion of returns around their mean. If returns frequently deviate significantly from their average, the standard deviation will be high, indicating elevated volatility. Standard deviation forms the basis of many quantitative risk models and is central to modern portfolio theory.
Another common metric is the Average True Range (ATR). Unlike standard deviation, which focuses on returns, ATR measures the average range between high and low prices over a defined period. It accounts for price gaps that may occur between trading sessions, offering a practical gauge of how much an asset typically moves within a day or another specified timeframe. Traders often use ATR to set stop-loss distances or determine position size.
Variance, which is the square of standard deviation, is also used in quantitative analysis. Although less intuitive in direct interpretation, variance is mathematically convenient in portfolio calculations. In addition, models such as Generalized Autoregressive Conditional Heteroskedasticity (GARCH) estimate how volatility evolves over time, capturing patterns such as volatility clustering, where large price changes tend to be followed by further large changes.
Market-based indicators provide another perspective. Indices derived from option prices aggregate expectations of future volatility across a range of strike prices and maturities. These tools offer insight into anticipated risk rather than solely observed past movements.
Implied Volatility
Implied volatility occupies a central role in derivatives markets, particularly in options pricing. It is embedded in the premium that traders are willing to pay for options contracts. Models such as Black-Scholes require volatility as an input; by rearranging the formula and observing market prices, practitioners can infer the volatility level implied by the market.
Higher implied volatility generally corresponds to more expensive options, as greater expected price movement increases the probability that an option will finish in the money. This relationship allows traders to evaluate whether options appear relatively expensive or inexpensive compared to historical norms.
Implied volatility often rises ahead of major scheduled events, such as earnings announcements or central bank meetings, reflecting anticipated uncertainty. After the event occurs, implied volatility may decline as uncertainty diminishes, a phenomenon often referred to as volatility contraction. For more detailed explanations on financial models and volatility metrics, educational resources such as Investopedia provide structured overviews of these concepts.
Understanding the difference between implied and historical volatility can inform strategic decisions. If implied volatility significantly exceeds historical volatility, the market may be pricing in larger future moves than have recently occurred. Conversely, low implied volatility may signal expectations of relative stability, though such expectations can change quickly if new information emerges.
Strategies for Using Volatility
Volatility influences a broad spectrum of strategies, from asset allocation to short-term trading. Rather than attempting to eliminate volatility, many investors seek to manage or utilize it systematically.
Risk Management
Risk management frameworks rely heavily on volatility estimates. Portfolio managers often adjust asset weights according to the volatility of each holding. In a diversified portfolio, assets with higher volatility may receive smaller allocations to maintain a targeted level of overall risk. This principle underlies volatility-weighted and risk-parity strategies, where exposure is distributed in proportion to risk rather than nominal value.
Stop-loss orders and position-sizing rules also incorporate volatility. For example, traders may place stops at multiples of the ATR to reduce the likelihood of premature exit due to ordinary price fluctuations. Similarly, the size of a position may be reduced when volatility increases, preserving capital by limiting the potential impact of adverse moves.
Hedging strategies become particularly relevant during periods of elevated volatility. Investors holding diversified equity portfolios may purchase put options or volatility-linked instruments to offset potential losses. While hedging introduces costs, it can stabilize portfolio performance and reduce drawdowns in turbulent markets.
Market Timing
Some participants attempt to integrate volatility analysis into market timing decisions. Periods of unusually low volatility may precede sharp breakouts if underlying tensions build within the market. Conversely, extreme spikes in volatility sometimes coincide with market bottoms, as widespread uncertainty prompts rapid repricing.
Technical analysts examine volatility bands, such as Bollinger Bands, which expand and contract based on standard deviation. When prices move beyond these bands, it may signal a shift in momentum or an overextended condition. Although such tools do not guarantee predictive accuracy, they provide structured methods for interpreting price dynamics.
Macroeconomic investors may also consider changes in volatility as reflections of shifting risk appetite. Rising volatility across asset classes can indicate tightening financial conditions, prompting adjustments in exposure to equities, commodities, or emerging markets.
Leveraging Volatility Indices
Volatility indices, such as the VIX, measure market expectations of near-term volatility implied by options on major stock indices. These indices are sometimes referred to as “fear gauges,” though they fundamentally represent anticipated price dispersion rather than sentiment alone.
Investors can gain exposure to volatility through futures, options, or exchange-traded products linked to these indices. Such instruments enable portfolio diversification because volatility often exhibits an inverse relationship with equity markets during stress periods. However, volatility-linked products may behave differently from spot indices due to factors such as futures roll costs and term structure dynamics.
Understanding the construction and behavior of these indices is essential before incorporating them into a strategy. Their performance can deviate from expectations if not aligned with investment horizons and risk tolerance.
Volatility Across Asset Classes
Different asset classes display distinct volatility characteristics. Equities generally exhibit higher volatility than government bonds because corporate earnings are more sensitive to economic cycles. Commodities can experience abrupt price movements driven by supply disruptions, weather patterns, or geopolitical developments. Currencies often reflect macroeconomic indicators, trade balances, and interest rate differentials.
Emerging market assets tend to show higher volatility compared with developed markets due to political uncertainty, lower liquidity, and greater sensitivity to global capital flows. Cryptocurrency markets have demonstrated particularly elevated volatility, influenced by technological developments, regulatory changes, and shifts in investor participation.
Cross-asset volatility analysis allows investors to identify diversification opportunities. Assets that respond differently to economic events may reduce overall portfolio volatility when combined appropriately.
Behavioral and Structural Drivers
Volatility is not solely a product of economic fundamentals; it is also shaped by behavioral and structural factors. Herding behavior can amplify price movements when investors collectively react to perceived risk. Algorithmic trading systems may intensify short-term fluctuations by executing large volumes of trades at high speed.
Market structure elements such as liquidity, leverage, and margin requirements influence volatility dynamics. Reduced liquidity can magnify price changes because fewer counterparties are available to absorb large orders. High leverage can accelerate sell-offs if falling prices trigger margin calls, compelling participants to liquidate positions.
Regulatory changes, circuit breakers, and trading halts are mechanisms designed to moderate extreme volatility. These tools aim to provide time for information dissemination and prevent disorderly market conditions.
Challenges and Considerations
While volatility offers analytical and strategic value, it presents challenges. Statistical measures rely on historical data, which may not fully predict future conditions. Structural breaks, regime changes, or unprecedented events can render historical volatility less informative.
Short-term volatility spikes can generate false signals, leading to excessive trading and increased transaction costs. Investors must distinguish between transient fluctuations and sustained trend changes. Maintaining a disciplined framework helps mitigate impulsive reactions to abrupt price swings.
Liquidity risk remains a critical concern. In highly volatile markets, the ability to execute transactions at expected prices may diminish. Wider bid-ask spreads and reduced market depth can increase costs and complicate risk management efforts.
Operational considerations also arise. Margin requirements often rise during volatile periods, increasing capital demands. Stress testing and scenario analysis help institutions assess potential exposures under extreme conditions.
Conclusion
Volatility is an integral feature of financial markets, reflecting the continuous adjustment of prices to new information and shifting expectations. By measuring volatility through statistical and market-based tools, participants gain insight into the scale and frequency of price movements. Incorporating volatility into risk management, asset allocation, and trading strategies enhances decision-making under uncertainty.
Effective use of volatility requires balanced interpretation. Elevated volatility can signal opportunity as well as heightened risk, while subdued volatility may conceal the potential for abrupt change. Through disciplined analysis and prudent management, investors and traders can integrate volatility into comprehensive strategies designed to navigate diverse market environments.
This article was last updated on: May 15, 2026