How to Measure Performance Separately for Trading and Investing Activities
admin - April 10, 2026Introduction
Understanding the difference between trading and investing is essential for assessing financial performance accurately. While both activities aim to generate profits in financial markets, they operate under different assumptions, time frames, risk exposures, and decision-making frameworks. Measuring results without recognizing these distinctions can lead to incorrect conclusions about skill, strategy effectiveness, and risk management.
Trading generally focuses on short- to medium-term price movements, often involving frequent transactions and rapid capital allocation decisions. Investing, by contrast, typically emphasizes long-term value creation, compounding, and capital preservation. These differing characteristics require tailored performance metrics. Applying investment metrics to trading results, or trading metrics to long-term portfolios, may distort the evaluation process.
When analyzing performance, it is also important to ensure consistency in methodology. Calculations should account for transaction costs, taxes, slippage, dividend reinvestment, and capital contributions or withdrawals. Investors and traders who seek a deeper understanding of core financial metrics may consult resources such as Investopedia for reference definitions and formula explanations. However, interpreting these metrics correctly requires understanding the structural differences between trading and investing.
Conceptual Differences Between Trading and Investing
Before examining specific metrics, it is useful to clarify how trading and investing differ in structure and objectives. Trading strategies typically rely on technical analysis, short-term news catalysts, market microstructure, or price momentum. Positions may be held for seconds, days, or weeks. The frequency of turnover is usually high, and transaction costs can significantly affect outcomes.
Investing strategies often depend on fundamental analysis, macroeconomic trends, company earnings growth, industry positioning, and long-term competitive advantages. Holdings may remain in a portfolio for years. Portfolio turnover is generally lower than in trading, and compounding plays a central role in total returns.
Risk exposure also differs. Traders frequently manage tight stop-loss levels and adjust exposure dynamically. Investors may tolerate higher short-term volatility if long-term fundamentals remain intact. These behavioral and structural distinctions directly influence which performance metrics are most appropriate.
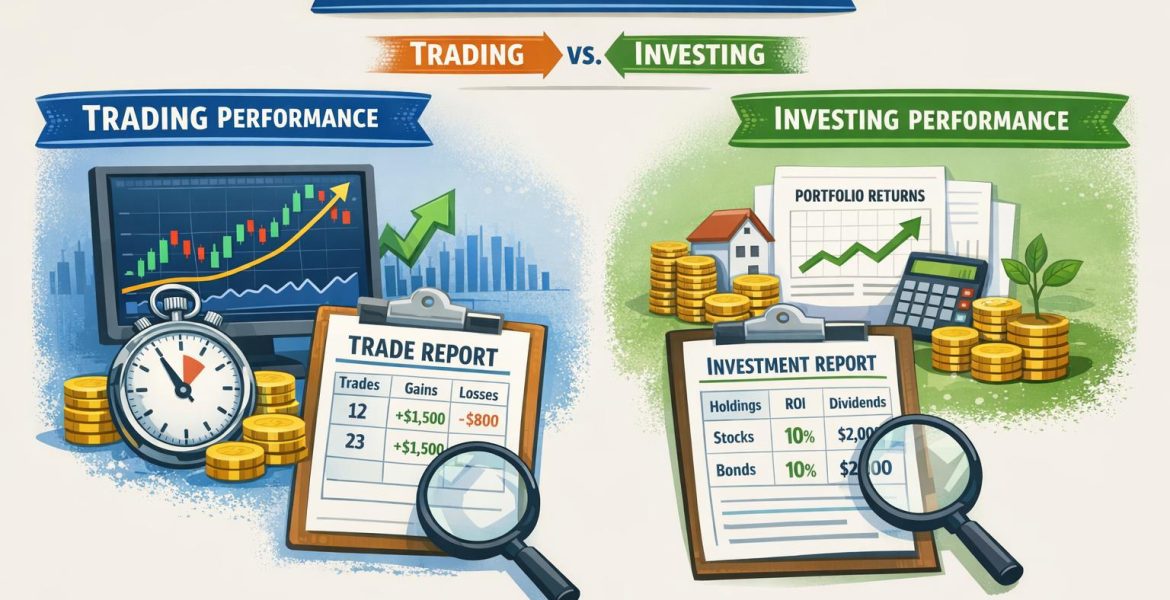
Trading Performance Metrics
Because trading involves shorter holding periods and frequent capital deployment, performance metrics must capture both return efficiency and risk exposure within compressed time frames.
Annualized Return
Given the short duration of many trades, raw percentage gains over a few days or weeks provide limited information. The annualized return converts shorter-term performance into a yearly equivalent rate. This allows comparisons across strategies and time horizons.
For example, a strategy generating 2 percent per month may appear modest, but when annualized, the compounded return is significantly higher. However, annualization can exaggerate results if short-term returns are not consistently repeatable. Therefore, interpreting annualized figures requires examining return stability and the length of the track record.
In trading, annualized return is particularly valuable when comparing systematic strategies, algorithmic trading systems, or professional trading accounts. It standardizes measurement despite varying trade durations.
Sharpe Ratio
The Sharpe Ratio measures excess return relative to volatility. Specifically, it calculates how much return a strategy generates above the risk-free rate for each unit of standard deviation in returns. Since trading strategies often generate volatile profit and loss streams, risk-adjusted performance becomes more important than absolute return alone.
Two traders may achieve the same annualized return, but if one experiences significantly higher volatility, the Sharpe Ratio will differentiate their risk efficiency. A higher Sharpe Ratio suggests that returns are generated more consistently relative to risk taken.
For high-frequency or algorithmic traders, the Sharpe Ratio is often a primary evaluation criterion. Institutional allocators frequently rely on it when comparing quantitative trading programs.
Win/Loss Ratio
The win/loss ratio measures the proportion of profitable trades to losing trades. While simple, it provides insight into the strategy’s structure. A trading system with a high win rate but small average profits may still underperform if occasional losses are substantial.
This metric is most informative when combined with average gain and average loss figures. For example, a trader with a 40 percent win rate may still be profitable if average winning trades significantly exceed average losing trades. Therefore, win/loss ratios should not be interpreted in isolation.
Traders often track this metric to identify behavioral biases, such as cutting winners too early or letting losses run. It serves as a diagnostic tool for execution discipline.
Maximum Drawdown
Maximum drawdown measures the largest peak-to-trough decline in account equity during a specified period. It is a fundamental risk indicator for traders because capital preservation directly affects their ability to continue operating.
A trading system with high returns but extreme drawdowns may be unsuitable for many market participants. Large drawdowns can trigger margin calls, forced liquidation, or psychological stress leading to strategy abandonment.
Drawdown analysis helps traders assess risk tolerance and capital allocation. It also assists in determining position sizing. Evaluating historical drawdowns allows estimation of potential capital requirements to sustain adverse market conditions.
Profit Factor
Another trading-specific metric is the profit factor, which compares total gross profits to total gross losses. A profit factor greater than 1 indicates profitability. This measure highlights the relationship between aggregate gains and losses rather than focusing solely on trade frequency.
In systematic trading evaluation, profit factor provides insight into the efficiency of a strategy’s logic. Combined with drawdown data, it helps determine whether profits justify the risks taken.
Expectancy
Trading expectancy calculates the average expected gain or loss per trade. It incorporates win rate, average gain, and average loss in a single figure. Positive expectancy implies that, over a large sample size, the strategy should generate profits.
Expectancy is particularly useful when analyzing high-volume strategies. It emphasizes statistical consistency rather than short-term outcomes.
Investing Performance Metrics
Investing performance measurement focuses more on long-term growth, income generation, stability, and market-relative behavior. Since investment horizons extend over years or decades, compounding and cyclical market trends must be considered.
Compound Annual Growth Rate (CAGR)
The Compound Annual Growth Rate represents the smoothed annual return over a specified investment period. Unlike simple average returns, CAGR accounts for compounding, making it highly relevant for long-term investors.
For example, an investment that rises 20 percent in one year and falls 10 percent the next does not produce a simple 5 percent average annual return. CAGR calculates the actual compounded growth rate over the period, reflecting the investor’s real experience.
CAGR is especially useful when comparing different long-term investment options, such as mutual funds, exchange-traded funds, or individual stocks held over several years.
Dividend Yield
For income-focused investors, dividend yield measures the annual dividend payment relative to the stock’s current price. This metric indicates the income component of total return.
Dividend yield becomes particularly relevant in low-growth or defensive sectors where income stability outweighs capital appreciation. However, high dividend yields must be evaluated carefully, as they may reflect declining stock prices rather than strong fundamentals.
Long-term investors often combine dividend yield analysis with dividend growth rates to assess sustainability and income expansion potential.
Price-to-Earnings Ratio (P/E Ratio)
The P/E ratio compares a company’s share price to its earnings per share. While not a direct performance metric, it plays a vital role in evaluating whether investment returns align with underlying earnings growth.
A rising stock price accompanied by stable earnings may increase the P/E ratio, indicating potential overvaluation. Conversely, stable or growing earnings with moderate valuation expansion often lead to more sustainable investment returns.
Long-term investors analyze historical P/E ranges to determine relative valuation levels and expected returns.
Beta
Beta measures a security’s volatility relative to the broader market. A beta above 1 suggests greater sensitivity to market movements, while a beta below 1 indicates lower volatility.
Beta is particularly valuable when constructing diversified portfolios. Investors seeking lower volatility may favor assets with low beta values. Conversely, those seeking higher potential returns may allocate capital to higher-beta securities.
Portfolio-level beta helps investors understand systematic risk exposure, especially during market downturns.
Alpha
Mutual fund managers and portfolio managers are often evaluated based on alpha generation. Persistent positive alpha suggests effective security selection or asset allocation decisions.
Total Return
Total return accounts for capital appreciation, dividends, and interest income. For long-term investments, total return provides a comprehensive measure of performance. Ignoring dividend reinvestment can significantly underestimate actual growth over time.
Comparing total return against relevant benchmarks, such as index funds, provides context for evaluating portfolio management effectiveness.
Risk Considerations in Performance Measurement
Accurate performance evaluation requires incorporating risk measures alongside return metrics. Traders often emphasize drawdown limits and volatility, while investors may focus on diversification and long-term standard deviation.
Other risk-related measures include Sortino Ratio, which adjusts returns using downside volatility, and Value at Risk (VaR), which estimates potential losses under normal market conditions. Although more complex, these metrics provide additional insight for institutional participants.
Liquidity risk, concentration risk, and leverage should also be considered. Leveraged trading can amplify both gains and losses, significantly altering risk-adjusted performance results.
Time Horizon and Performance Interpretation
Time horizon plays a central role in evaluating success. Short evaluation periods may produce misleading conclusions due to market noise. Traders may experience extended drawdowns within profitable long-term systems, while investors may face temporary bear markets that do not reflect structural portfolio weaknesses.
Performance measurement should therefore align with strategy duration. A day trading strategy should not be judged solely on multi-year CAGR without considering volatility and turnover. Likewise, a long-term investment portfolio should not be evaluated solely on monthly fluctuations.
Consistency of returns across varying market conditions is an important factor in both domains. Evaluating performance during bull markets, bear markets, and sideways markets offers a broader understanding of strategy resilience.
Costs and Their Impact on Performance
Transaction costs, management fees, spreads, and taxes affect both trading and investing outcomes. However, high-frequency trading strategies are particularly sensitive to cost structures. Even modest commission increases can significantly reduce net profit.
Investors must consider expense ratios in mutual funds or ETFs, advisory fees, and tax implications of turnover. Long-term compounding magnifies the effect of seemingly small annual expense differences.
Performance metrics should ideally be calculated on a net-of-fees basis. Gross performance may overstate real, investable returns.
Behavioral Influences on Measured Results
Behavioral factors often influence trading and investing performance. Overtrading, deviation from investment plans, or emotional decision-making can distort results relative to a defined strategy.
From a measurement standpoint, maintaining disciplined records is essential. Tracking entry and exit points, rationale for decisions, and adherence to risk limits allows clearer evaluation of process quality in addition to numeric return figures.
Performance metrics quantify outcomes, but qualitative review of strategy execution adds another dimension to proper evaluation.
Benchmark Selection
Selecting an appropriate benchmark is critical for both trading and investing. Traders may compare performance to cash returns or short-term treasury yields, particularly if strategies aim for market-neutral exposure. Investors generally compare portfolios to equity or bond indices aligned with their asset allocation.
Improper benchmark selection can distort alpha and beta calculations. A technology-focused investor should not be compared to a broad defensive index, just as a derivatives trader should not be evaluated solely against long-only equity indices.
Benchmark alignment ensures that performance assessments reflect actual strategic intent.
Conclusion
Measuring trading and investing performance requires understanding the structural differences between short-term market engagement and long-term capital allocation. Traders typically rely on metrics such as annualized return, Sharpe Ratio, win/loss ratio, profit factor, expectancy, and maximum drawdown, all of which address frequent transactions and compressed time horizons.
Investors, by contrast, often focus on CAGR, dividend yield, P/E ratio, beta, alpha, and total return, reflecting long-term growth, income generation, and market-relative risk.
Both activities require integrating return measures with risk metrics, cost considerations, and benchmark comparisons. By applying appropriate methodologies aligned with strategic objectives and time horizons, individuals and institutions can evaluate financial market performance with greater clarity and consistency.
This article was last updated on: April 10, 2026